
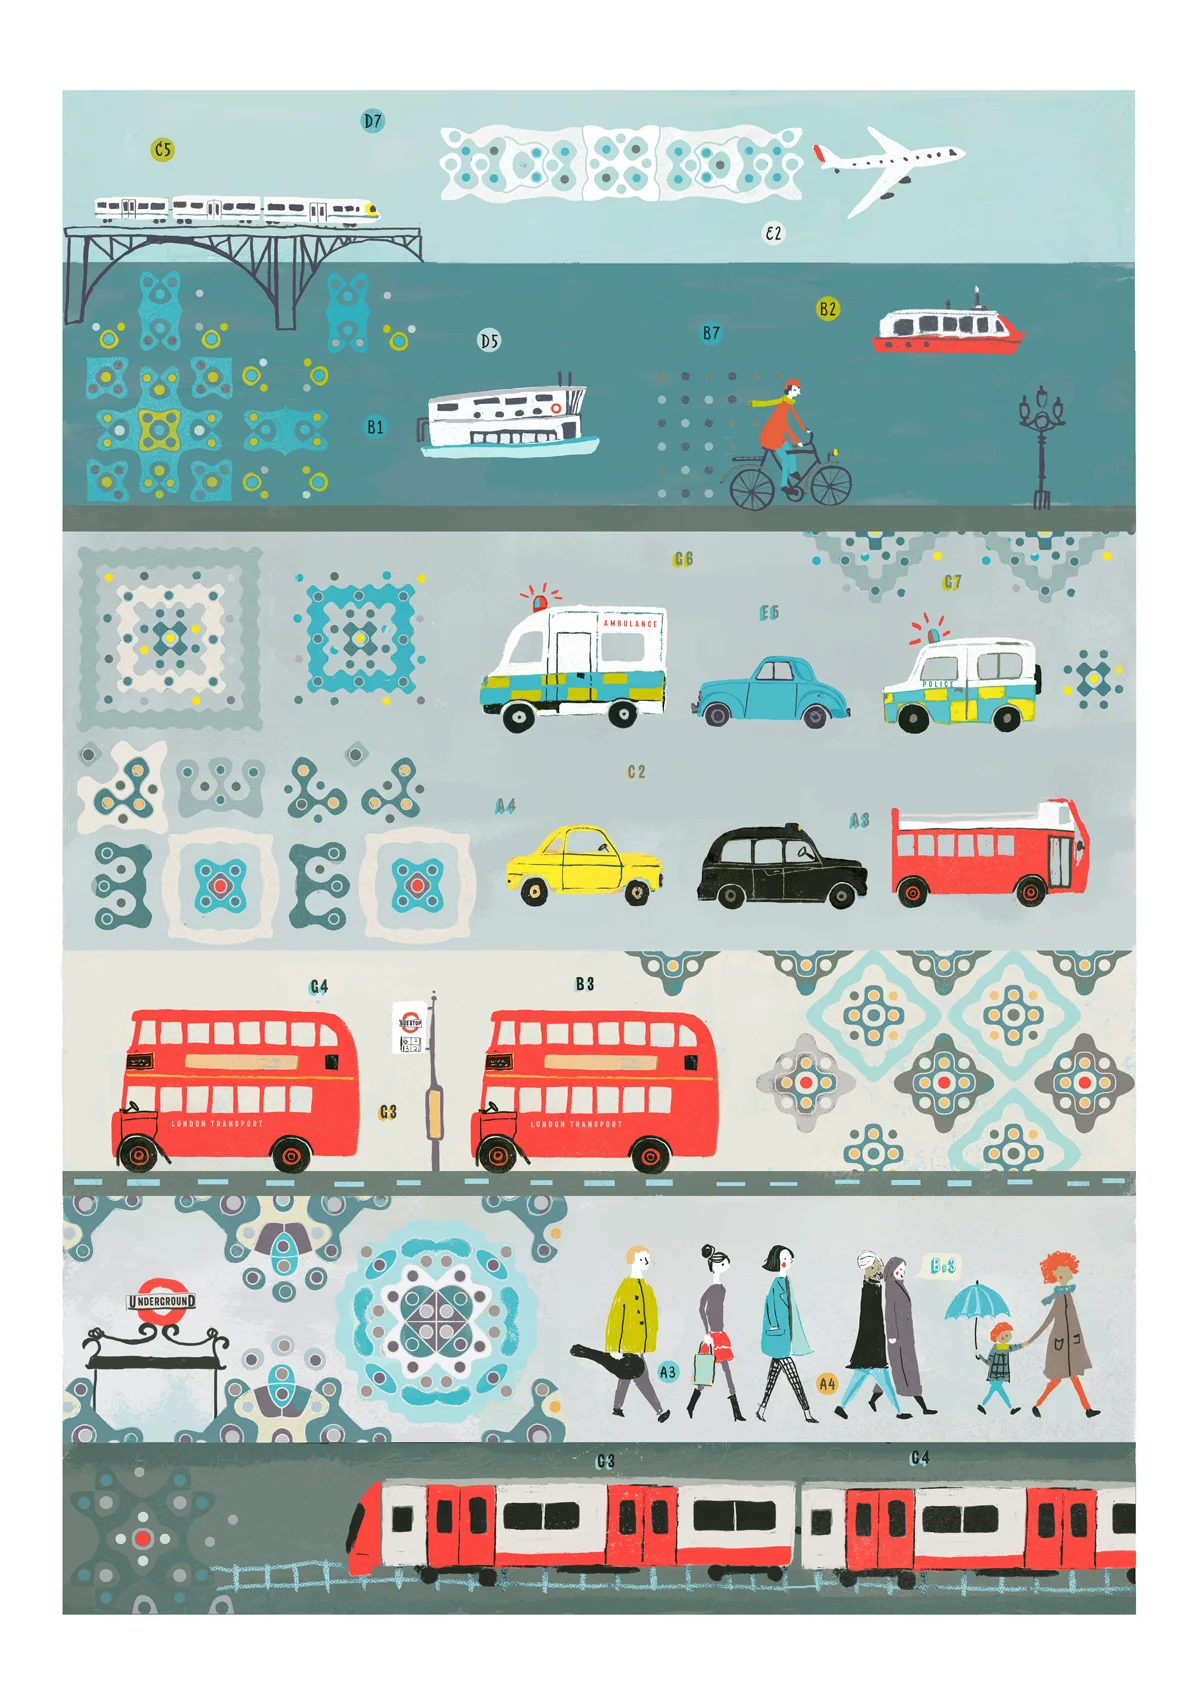
City Visual Frequencies POSTER at the London Transport Museum
Sound waves can be visualised in sand on the surface of a vibrating metal plate. The vibrations create beautiful geometric patterns called Chladni figures. London city sounds were recorded and analysed for tone frequencies, then represented with Chladni patterns. The poster will be exhibited at the London Transport Museum this summer.

Chladni figure note A3

Chladni figure note G3

Chladni pattern visualisation of the A3 music note.

Chladni pattern visualisation of the G4 music note.